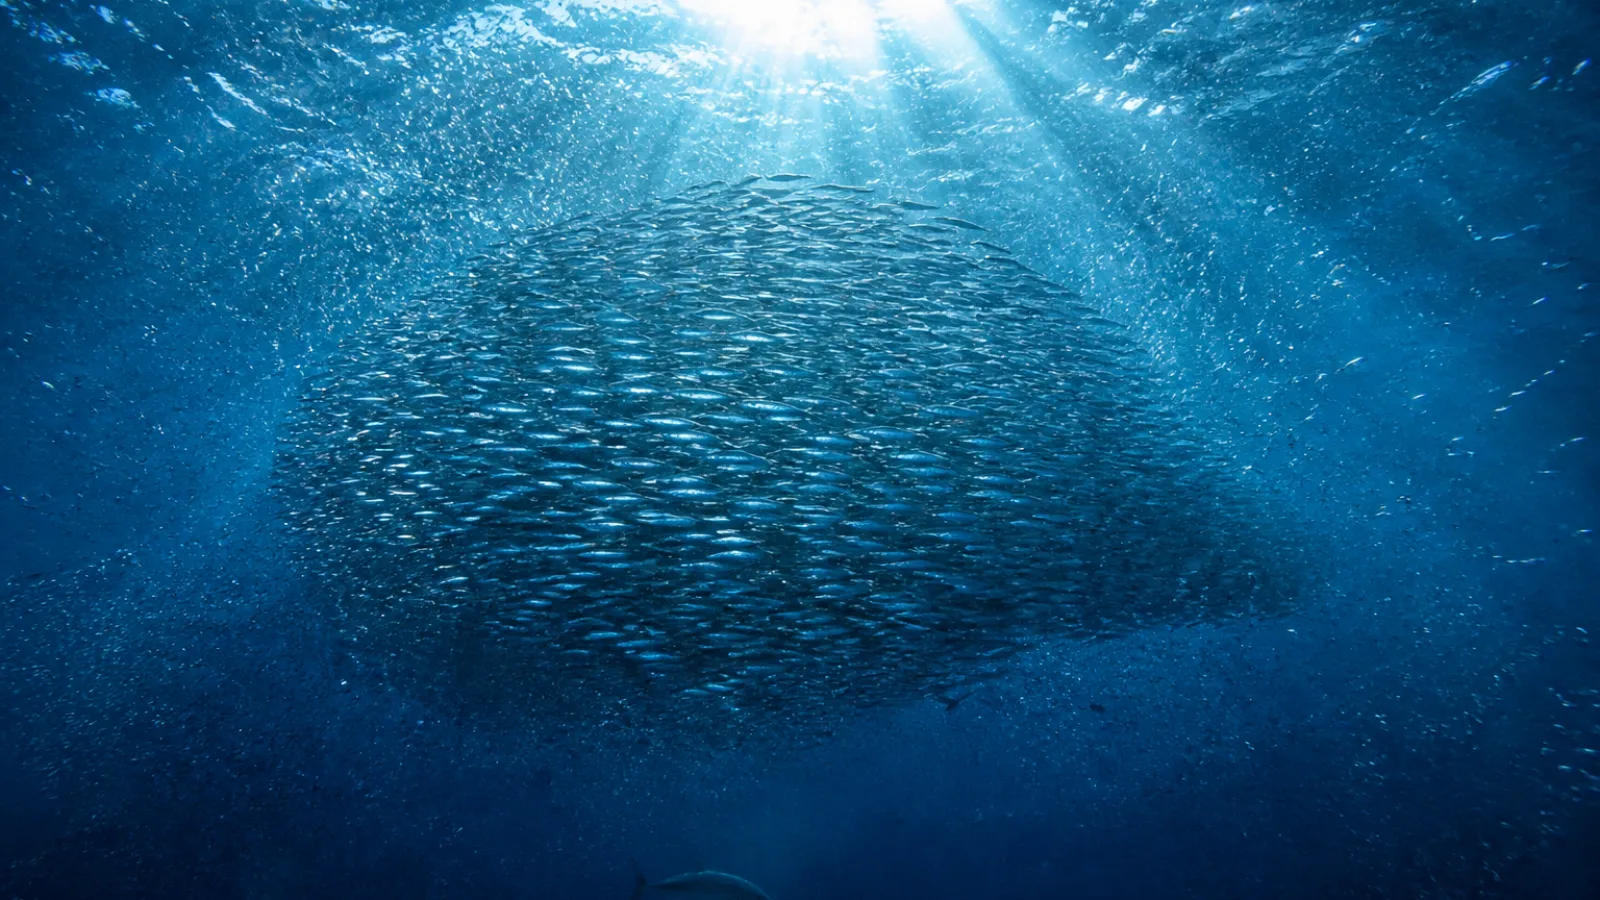
Every large predator in the sea is, at several removes, made of sunlight. Light captured by microscopic algae in the upper few hundred feet of water becomes the tissue of copepods and krill, which becomes the tissue of small fish and squid, which becomes tuna, sharks, seals and whales. The chain is short in some places and long in others, and at every link most of the energy is lost. Understanding those losses explains most of what is otherwise puzzling about ocean life.
It explains why the largest predators are also the least numerous, why a single sperm whale requires an area of ocean the size of a small country to support it, why removing one species can visibly change a coastline, and why the flesh of long-lived hunters concentrates contaminants that were harmless where they entered the water. This guide follows energy upward from primary production, then looks at the sideways paths and feedbacks that a simple ladder of trophic levels leaves out.
Everything Starts With Phytoplankton
Marine primary production is dominated not by seaweed or seagrass but by single-celled drifting algae and photosynthetic bacteria, collectively called phytoplankton. Individually invisible, they account for roughly half of all photosynthesis on Earth, a share comparable to every forest and grassland combined. Because they are eaten and replaced within days, the standing stock at any moment is tiny relative to the amount produced over a year, which is the opposite of a forest, where most of the carbon sits in long-lived wood.
Production is not spread evenly. Phytoplankton need light and dissolved nutrients, and those two requirements are usually found at different depths, since light is at the surface and nutrients accumulate below where sinking material decomposes. Production is therefore highest where physical processes bring deep water up: coastal upwelling zones off Peru, California, northwest Africa and Namibia, and the turbulent Southern Ocean. Large areas of the tropical open ocean are permanently nutrient-poor, and parts of the Southern Ocean have ample nitrogen and phosphorus but too little dissolved iron to use them.
Trophic Levels and the Cost of Each Transfer
A trophic level describes how many steps a consumer sits above primary production. Phytoplankton occupy level one, the copepods and krill that graze them are level two, small fish eating those grazers are level three, and so on upward. Real animals rarely land on a whole number, because most eat across several levels, so ecologists express the value as a decimal derived from stomach contents or stable isotope ratios. A predator at trophic level 4.5 is drawing energy from a mixture of prey at different heights in the web.
The critical fact is that each transfer wastes most of what it moves. A consumer spends energy on swimming, breathing, maintaining tissue and reproducing, and loses more in undigested waste. What remains as new body tissue available to the next level is typically about a tenth of what was eaten, with real values ranging from a few percent to roughly a quarter depending on the species and the temperature. Compounded over four or five steps, that arithmetic sets a hard ceiling on how much predator biomass a stretch of ocean can carry.
A representative open-ocean chain
- Level 1: phytoplankton, capturing sunlight and dissolved nutrients in the sunlit surface layer.
- Level 2: copepods, krill and other zooplankton that graze the algae, often within hours of its formation.
- Level 3: small schooling fish such as anchovies, sardines and lanternfish, plus juvenile squid.
- Level 4: mid-sized predators including mackerel, small tuna and reef fish, along with most squid.
- Level 4.5 and above: large sharks, billfish, big tuna, toothed whales and predatory seals, a group necessarily thin on the ground.
The Microbial Loop
The simple ladder leaves out most of the traffic. A large share of what phytoplankton produce, along with everything that leaks from damaged cells, is excreted or dies uneaten, dissolving into the water as organic molecules. Bacteria take up that dissolved material and are grazed in turn by microscopic protists, which are eaten by slightly larger plankton. This side channel, the microbial loop, routes carbon back into the food web through several extra steps rather than losing it, and viruses infecting bacteria return a further portion to the dissolved pool.
The loop matters to large predators because every extra step costs energy. In warm, nutrient-poor open ocean the microbial pathway handles most of the production, so relatively little reaches large animals and top predators are sparse. In cold, nutrient-rich water, large diatoms bloom and are eaten directly by krill and copepods, which puts big packets of food only one or two steps from a fish or a whale. The physical setting effectively determines how many tolls the energy pays on the way up.
Krill: A Short Chain in the Southern Ocean
The Southern Ocean is the clearest illustration of a short chain supporting large animals. Antarctic krill, a shrimp-like crustacean two inches long, graze diatoms and ice algae directly and form swarms dense enough to color the water for miles. Estimates of total biomass are on the order of 300 to 500 million tons, though the figure carries large uncertainty because the swarms are patchy and hard to survey. What matters ecologically is that this vast quantity of food sits at trophic level two.
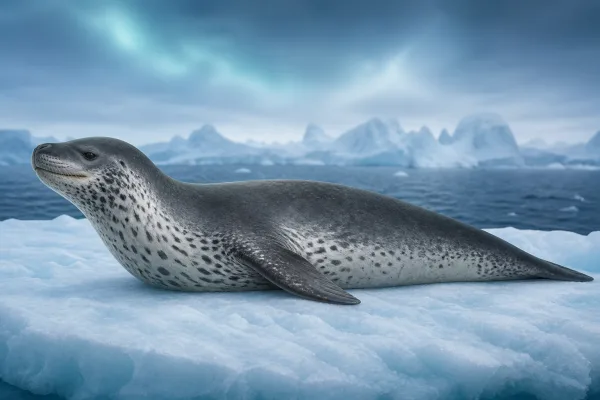
That compression is why the Antarctic supports so many large predators on so few links. Baleen whales, crabeater seals and several penguins feed on krill directly, and animals that eat those consumers, including leopard seals and orcas, are still only three or four steps from photosynthesis. Because so much depends on one genus, the system is unusually exposed: krill recruitment is tied to winter sea ice, which shelters the algae young krill feed on, so a run of low-ice years propagates upward through predators quickly. Whether the long-term trend in krill distribution is a southward contraction is still actively debated among survey programs.
The Largest Daily Migration on Earth
Each evening, an immense population of small fish, squid, krill and jellyfish rises from the twilight zone into the surface layer to feed under cover of darkness, then descends again before dawn to depths where visual hunters cannot easily follow. Individual animals may travel 1,000 feet or more in each direction. Summed across the world ocean, this vertical migration involves more biomass in motion every day than any other animal movement on the planet, and it was first detected as a phantom sea floor on wartime sonar.
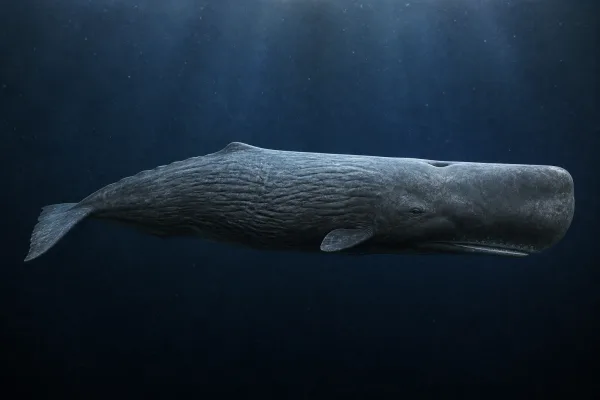
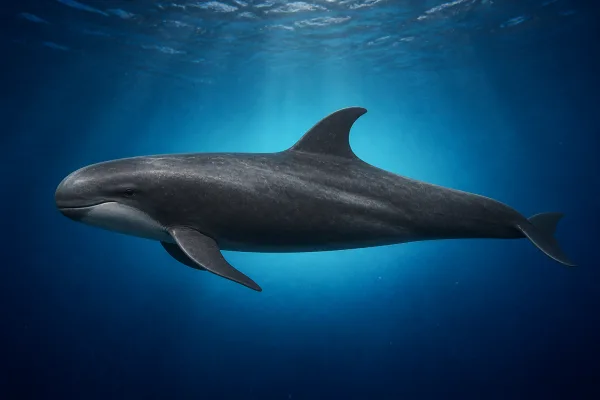
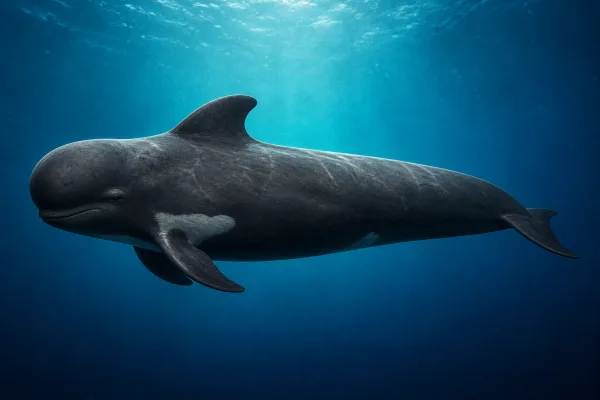
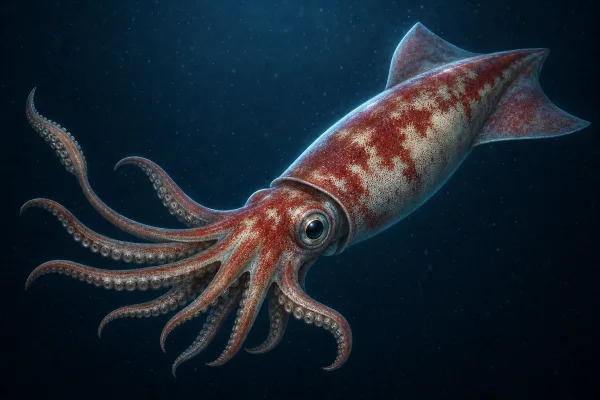
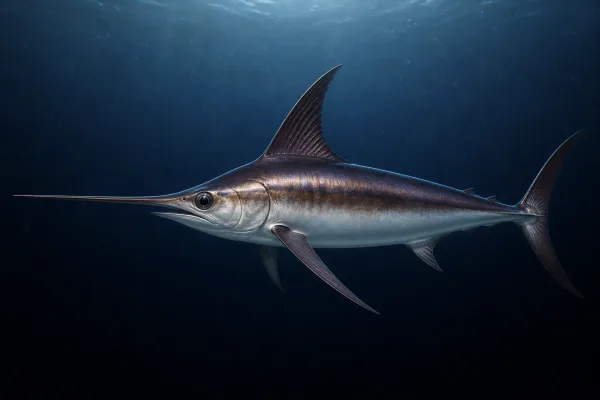
Estimates of the total mass involved have been revised sharply upward as acoustic methods improved, from around a billion tons of mesopelagic fish to figures several times higher, though the true number remains disputed because these fish avoid nets and reflect sound weakly. The migration functions as a conveyor, carrying surface production down to depth every night. Sperm whales, swordfish, short-finned pilot whales and Humboldt squid all organize their lives around intercepting it, and the deep-diving predators of the open ocean are largely feeding on animals that were at the surface hours earlier.
Whale Falls and the Biological Pump
Not all downward transport is voluntary. Sinking particles of dead plankton, cast-off feeding structures and fecal pellets, known collectively as marine snow, continuously remove carbon from the surface and deliver it to the deep sea, a process called the biological pump. Estimates of the amount exported below the sunlit layer each year run to several billion tons of carbon. Most is consumed or remineralized on the way down, which is exactly why the deep sea is food-poor: the pump leaks badly along its length.
The occasional exception is spectacular. When a large whale dies and sinks, it deposits tens of tons of tissue in one place on a sea floor accustomed to receiving dust. These whale falls support a documented succession of communities, beginning with scavengers such as hagfish and sleeper sharks, followed by bone-eating worms and bacterial mats that can persist for decades. Living whales run the pump in the other direction as well, feeding at depth and releasing nutrient-rich waste in surface waters, which fertilizes the plankton that ultimately feeds them.
"Apex Predator" Is a Role, Not a Rank
The phrase apex predator describes a position in a particular food web, not a badge of superiority or a place in a league table. It means an animal that, as a healthy adult in its own habitat, is not routinely eaten by anything else. That status is conditional in several ways. It is local, because a species can be an apex predator in one region and prey in another. It is temporary, since almost every large predator spends its early life as prey. And it is not exclusive, as many ocean ecosystems have several apex predators taking different prey at once.
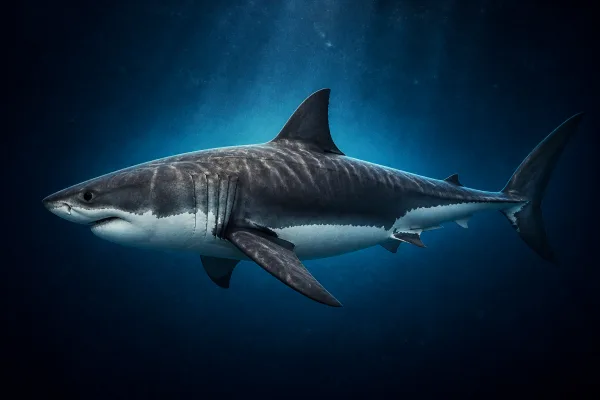
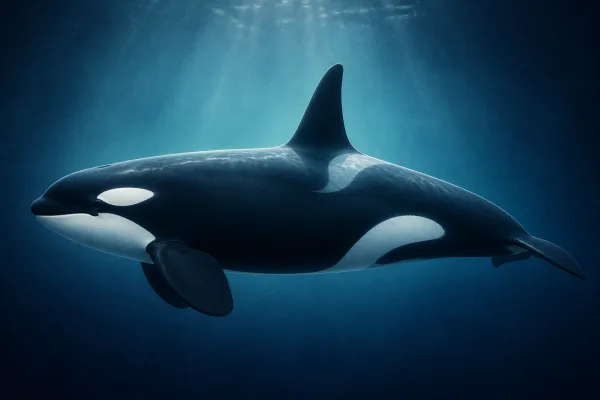
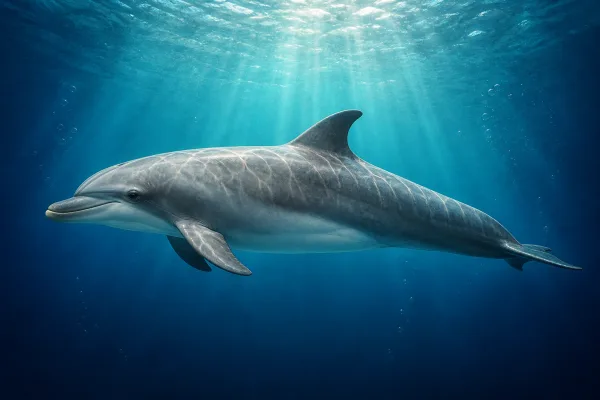
Diet also shifts with size and season, which blurs the boundaries further. Great white sharks feed on fish and rays as juveniles and add seals only once their jaws and teeth can handle large struggling prey, so a single individual moves up half a trophic level over its life. False killer whales take large fish including tuna and mahi-mahi, while common bottlenose dolphins across their range function as flexible mid-web generalists that are themselves taken by large sharks. Orcas are the closest thing the ocean has to an unqualified apex predator, and even they are organized into populations with narrow, learned specializations rather than one general strategy.
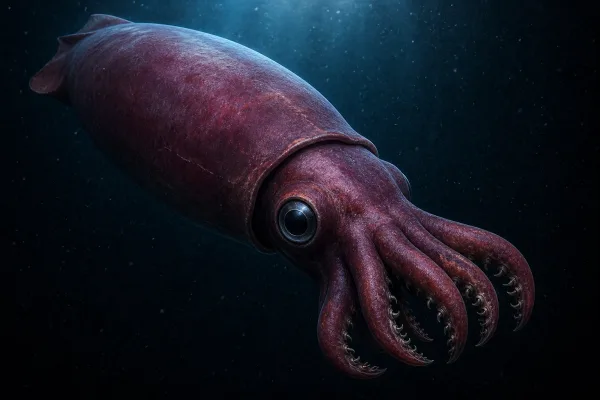
The clearest reminder that the label is situational comes from the deep Southern Ocean. Colossal squid are formidable predators of large fish, equipped with hooked tentacles and the largest eyes of any known animal, and yet their beaks turn up in quantity in the stomachs of sperm whales. Two animals can each be the dominant hunter of its own surroundings and still meet as predator and prey when their ranges overlap.
Trophic Cascades
Because energy moves upward but influence moves downward, removing a predator can restructure a whole community. The best-documented marine case is the North Pacific kelp system. Sea otters eat sea urchins, urchins graze kelp, and where otters were hunted out in the 18th and 19th centuries urchin populations expanded and stripped kelp forests to bare rock. Where otters returned, kelp returned with them. The pattern has been observed repeatedly across the Aleutians and the California coast, and it remains the standard example of a three-level cascade.
Other cases are less clean, and honesty about that is important. Global reef surveys show sharks absent or nearly absent from a substantial share of reefs, and some studies report the expected increase in mid-sized predators and shift in reef fish communities, while others find no consistent signal once fishing pressure on other species is accounted for. A widely discussed proposal that orcas switching to sea otters drove the Aleutian otter collapse of the 1990s is still contested. The general principle that predator removal has consequences is well supported; predicting which consequences, in which system, is not yet reliable.
How well-supported different cascades are
- Sea otters, urchins and kelp in the North Pacific: strong evidence from long-term observation and repeated natural experiments.
- Loss of large sharks on coral reefs: shark declines are well measured, but the downstream effects on reef fish communities vary between studies and regions.
- Predation on krill-dependent seals and penguins in the Southern Ocean: strongly influenced by sea ice and krill availability, which makes predator effects hard to separate from climate.
- Orcas as the cause of the Aleutian sea otter decline: an influential hypothesis that remains actively debated rather than settled.
Mercury and the Cost of a Long Life
Some substances travel up food webs more efficiently than energy does. Mercury enters the ocean from volcanic sources, coal combustion, mining and industrial discharge, and bacteria in low-oxygen sediments and midwater convert part of it to methylmercury, a form that binds readily to proteins in muscle. Because it is retained rather than excreted, each consumer accumulates the mercury of everything it has ever eaten, and concentrations rise with every step upward through the web.
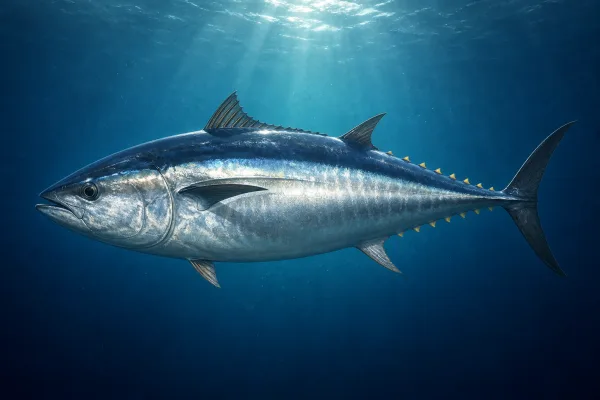
Two consequences follow. Long-lived predators carry the highest burdens, since accumulation continues for the animal's entire life and large sharks, swordfish and Atlantic bluefin tuna live for decades at high trophic levels. And deep-diving predators are often more exposed than surface hunters, because methylmercury production is concentrated in oxygen-poor midwater. This is the biological reason behind public health advice in the United States on limiting consumption of swordfish, shark and large tuna, and it is also a research tool, since mercury and stable isotope levels in tissue reveal what an animal has been eating for years.
Food Webs Are Not Fixed
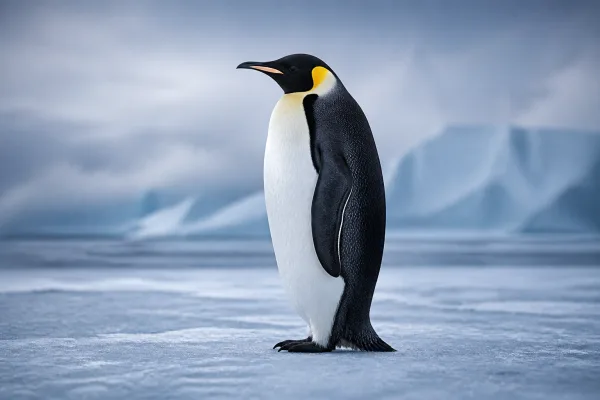
Ocean food webs are often drawn as static diagrams, which conceals how much they move. Upwelling strengthens and weakens; El Niño events shut down production off South America for a season and redistribute prey along thousands of miles of coast; and multi-year regime shifts have repeatedly reorganized which fish dominate the North Pacific and North Atlantic. Predators respond by moving, switching prey or breeding less successfully, and populations of emperor penguins and other tightly constrained species reflect these swings within a few seasons.
This variability is one reason ecological questions about the sea take decades to answer. A single year of survey data cannot distinguish a lasting decline from a normal fluctuation, and the most useful conclusions come from programs that have measured the same water for thirty years or more. It is also why cause and effect are hard to assign: fishing, warming and natural cycles frequently push in the same direction at the same time, and separating their contributions is genuinely difficult rather than merely unresolved.
Sources
-
Smithsonian Ocean
Smithsonian National Museum of Natural History
Peer-reviewed public science writing on marine life, ecosystems and ocean change.
-
Species Directory
NOAA Fisheries
Management-grade biology, distribution and stock information for species in United States waters.
-
National Ocean Service
NOAA
Reference material on ocean zones, currents, habitats and coastal processes.
-
Monterey Bay Aquarium Research Institute
MBARI
Deep-sea observations, including remotely operated vehicle records of squid and midwater predators.
-
British Antarctic Survey
Natural Environment Research Council
Antarctic field research on seals, penguins and Southern Ocean food webs.
Figures on this page were last checked against these sources on .